Concepts and Tools for Nonlinear Stretching: The Histogram and GHS
A deep-sky image, right after stacking, always looks pitch black; it has to go through stretching to bring out the signal hidden in the dark. This article covers two pieces of basic homework, before and after stretching, that are often overlooked: first learn to read the histogram, then get to know the stretching tool GHS.
The Story the Histogram Wants to Tell You
A freshly stacked, not-yet-stretched deep-sky image can actually reveal a lot through its histogram. From the position and width of the peak, and the distribution across each channel, you can roughly judge how this session’s capture went.
For example, I once examined an image’s histogram and could tell from it that the shooting problem with this image was that the Gain was set too high. For friends using a DSLR, Gain roughly corresponds to the ISO concept on the camera. In other words, before you even lift a finger to stretch, the histogram has already pointed out the problem for you.
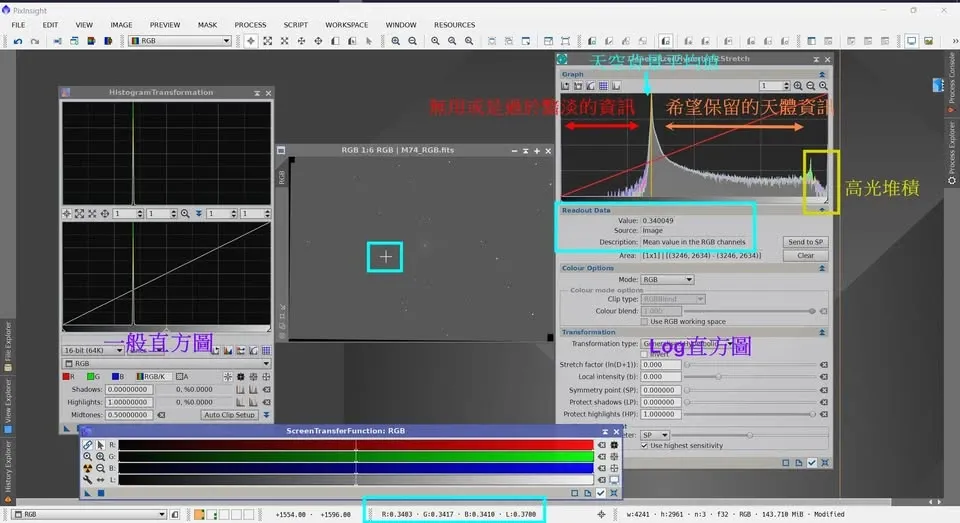
How to Use the GHS Process (Script)
Entering the stretching stage, GHS (Generalized Hyperbolic Stretch) is a tool that’s been much discussed in recent years. It’s a fairly flexible stretch process, but one that takes some effort to understand.
As for learning resources on GHS, I personally highly recommend Adam Block’s tutorial videos. This is the most detailed and clearest explanation currently on the internet; the content is even easier to follow than the videos by GHS’s own author, and it comes with actual image demonstrations. If you’re still only half-clear on GHS, it’s well worth spending the time to watch it through; if your English listening isn’t great, you can turn on Chinese subtitles to help.
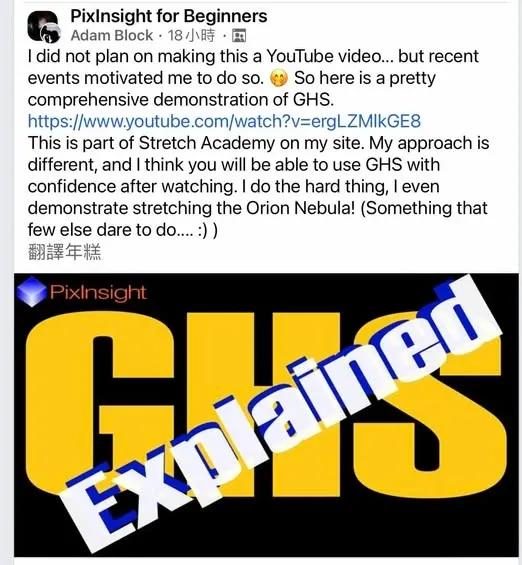
To dig deeper into using GHS, search for Adam Block’s GHS tutorial videos.